ICT Sessions (Kill Zones)Inspired by the work of ICT (Inner Circle Trader - @ICT_MHuddleston)
What are ICT KillZones:
All ICT students know that certain moments of the day are more indicated to search for good frameworks. These moments are indicated like "Kill Zones".
The best kill zones to search for profittable tradings are during the London session and during the New York session.
How This Indicator Can Help You:
With this indicator you'll see plotted in the charts the London Kill Zone and the New York Kill Zone, you'll see exactly when they start and finish, so you'll be able to understand better the price action and recognize if there are ICT framework to trade. You'll also will see when the New York lunch hour happen (this moment is not favorable for searching frameworks) and you'll see also 2 very important moments of the day, the 8.30 New York Time and the 9.30 New York Time, infact in these 2 particular moments it is most likely that some very profittable framework will appear as there are alway important economic news released in these 2 hours.
Also you'll see the New York Midnight Open, that always forms a very important level for the day trading, you could see the New York Midnight open as a real opening for markets.
Why This Indicator:
I looked for indicators working with these concepts and I could not find one that offered the kill zones sections in the way are showed in my indicator, also they just had the kill zones without showing the 8.30 and 9.30 hours and without the Ney York midnight opening, and these are very important time frames for who works with ICT concepts.
About The Indicator:
In this indicator you'll have displayed:
The regular trading sessions displayed, that is: Asian Session, London Session, New York Session.
The London Kill Zone
The New York Kill Zone
The New York Midnight Open
The New York Lunch Hour
The 8:30 News Release Hour
The 9:30 News Release Hour
All these level can be adjusted and changed as you prefer.
스크립트에서 "Inner circle trader "에 대해 찾기

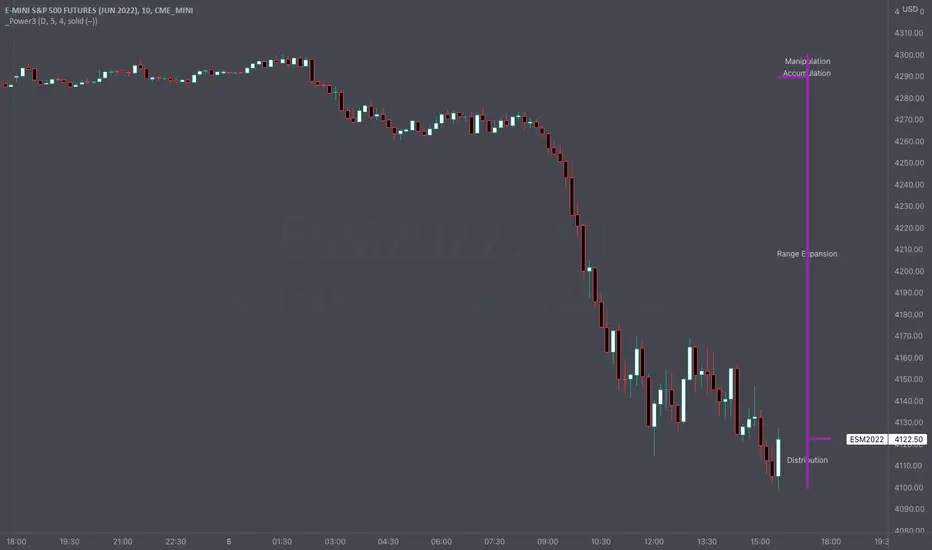
Intraday Power 3 VisualDescription
This indicator draws a dynamic "Open High Low Close" type visual on intraday charts so the trader can easily keep track of the daily/weekly movement. This indicator was inspired by the Inner Circle Trader’s (ICT) “Power 3” concept, which is Accumulation, Manipulation, and Distribution of price on a daily timeframe.
Visual
This indicator plots the chosen timeframes opening price along with a live line for the current price. This makes it very easy to identify the daily/weekly range along it’s open. And the user can combine this indicator with my other indicator “Futures Exchange Sessions” to plot the midnight EST & 8:30 AM EST lines to get a great summation of over night price action.
Inputs and Style
In the Input section the user can dynamically switch between Daily and Weekly timeframes. Built in ability to move the entire Visual to the right makes preventing indicator overlap a breeze. All of the lines can be configured: color, style, and width. Independently toggle ON/OFF the Power 3 labels (Accumulation, Manipulation, Range Extension, Distribution) and can change labels color. The labels dynamically move and switch positions based upon bear or bull daily/weekly range.
Special Notes
The Futures market is open 23/5. It is closed everyday for 1-hour at 5pm EST and closed over the weekends. Because this Intraday Power 3 Visual is drawing in the 'future' on the users TradingView chart, when the visual is close or in a time when the market is closed, the visual doesn't behave properly. This is because TradingView doesn't display times when the Market is closed, thus the drawings cannot be displayed during those times. There is nothing wrong with the script. Please wait until the Market is open and the visual will be drawn normally.
This indicator is intended for use in the Futures Market
Futures Exchange SessionsIn the 24-hour trading of the futures market, this indicator provides the user with full customization concerning the most important factor: time. This indicator is centered around three main visualizations: labels, backgrounds, and lines that minimalistically allows the user to keep track of the many time intervals that occur during a futures market 24-hour trading cycle. It also artfully displays the previous days highs and lows. And everything can be individually toggled and configured so the user can get exactly what they want.
Labels
There are three main futures market sessions in a 24-hour period: the London, New York, and Asian Sessions. Each session is given an independent label for the open and close times. The six labels (LO, LC, NYO, NYC, AO, AC) can be individually toggled on or off, the label background color changed, the text switched between black or white, and the height can be lowered or raised. These customizations are intended to give the user full control of the session they are interested in at the moment.
Backgrounds
Backgrounds are the heart of this indicator. There are different colored transparent backgrounds for each of the futures sessions. So the user can clearly see the session they want to highlight without cluttering their chart and getting in the way of analyzing the candles.
If you are familiar with the London and New York killzones, these backgrounds are each individually configured.
If you are familiar with the Inner Circle Trader’s (ICT) NY Morning and Afternoon sessions, these are available. Also, most times weird price action occurs during the lunch hour of these sessions. The London and New York have a background for their respective lunch hours so the user is never caught of guard during these periods.
Lines
The markets are constantly looking for liquidity. To help the user see runs on liquidity, this indicator projects the previous days highs and lows on to the current day with a line and a price label. The line make it very easy to see where price may be headed. See the image below for the perfect example of this phenomenon. Each of the lines can be independently controlled by color, style, and width. And even the labels can be toggled on or off if the user would prefer just to see the lines. Lastly, there is a line that marks the midnight open price in EST.
Special Notes
This indicator is specifically designed for futures tickers.
All of the backgrounds are not designed to be turned on a once (there are many that overlap). They are designed to give the user ultimate control over exactly what timeframe backgrounds to display on their charts.
The labels only appear when timeframe is 1 hour or less.

Auto Order Block by D. BrigagliaThis indicator finds trend following engulfings, and draws order blocks based on the 1st candle's range (the first candle of the engulfing pattern).
It does filter the trend with simple moving averages of 21 and 55 periods, but it doesn't filter for retracements in the trend (you should consider only the order blocks that are coming from engulfings after a retracement)
